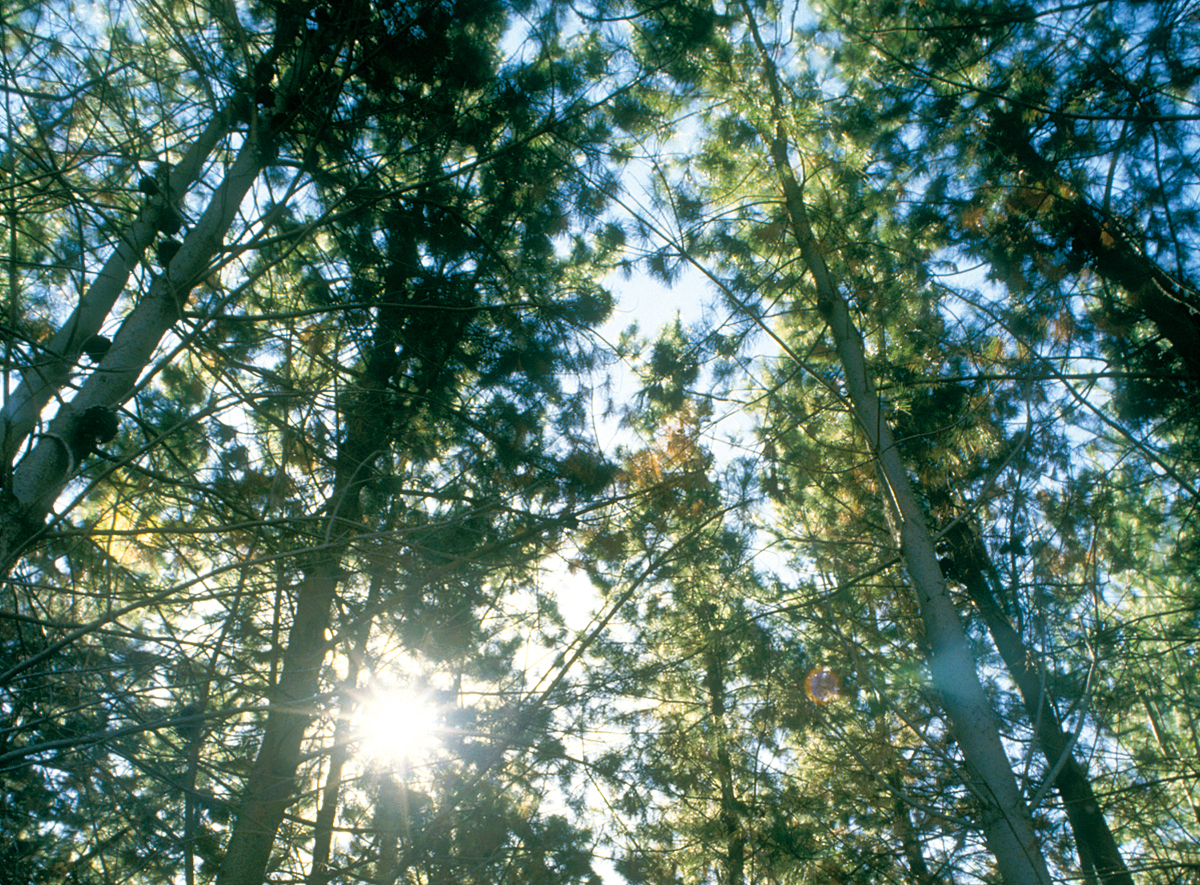
WHEN we look at images of our planet taken from the great expanse of space, we see the oceans and clouds swirling across the blue marble; on terra firma we see the rain, the rivers, lakes, reservoirs, the ice; all components of the water cycle.
Earth’s unique hydrological cycle includes one process trickier to quantify than others.
Invisible to the eye is the water which evaporates from the Earth’s surface, from the oceans and the soils, and transpires from each leaf of every living plant – the process of evapotranspiration (ET).
Understanding human impact on our limited water resources has to include quantifying that process, too. There is a lot that evapotranspiration can tell us about how much water is present and, critically, how much is being used.
Novel use of data from two satellites systems, with complementary sampling characteristics, is giving a more complete picture of the water balance. It’s providing a truer account of actual evapotranspiration rates which will help us to be more accountable for the water we use. In a dry land like Australia, ET accounts for approximately 90 per cent of the precipitation, the remaining 10 per cent is available for surface water and ground water. So being able to better estimate the major water balance ‘usage’ term means the other components, that are available for human, industry and ecological use, are more accurately estimated.
Novel use of satellite data
Hydrologists call it closing the water balance, accounting for water in all its states circulating in a region.
Dr Tim McVicar leads the Time Series Remote Sensing team within CSIRO’s Environmental Earth Observation group and uses remote sensing to monitor actual evapotranspiration.
There’s long been a small problem with remote sensing and its usefulness in helping close the water balance: the very clouds which play such a critical role in the water cycle.
To overcome the cloud problem, McVicar’s team has focused on data fusion of multiple satellite datasets.
They’ve used data from the Landsat satellites which, says the US Geological Survey, “represents the world's longest continuously acquired collection of space-based moderate-resolution land remote sensing data”.
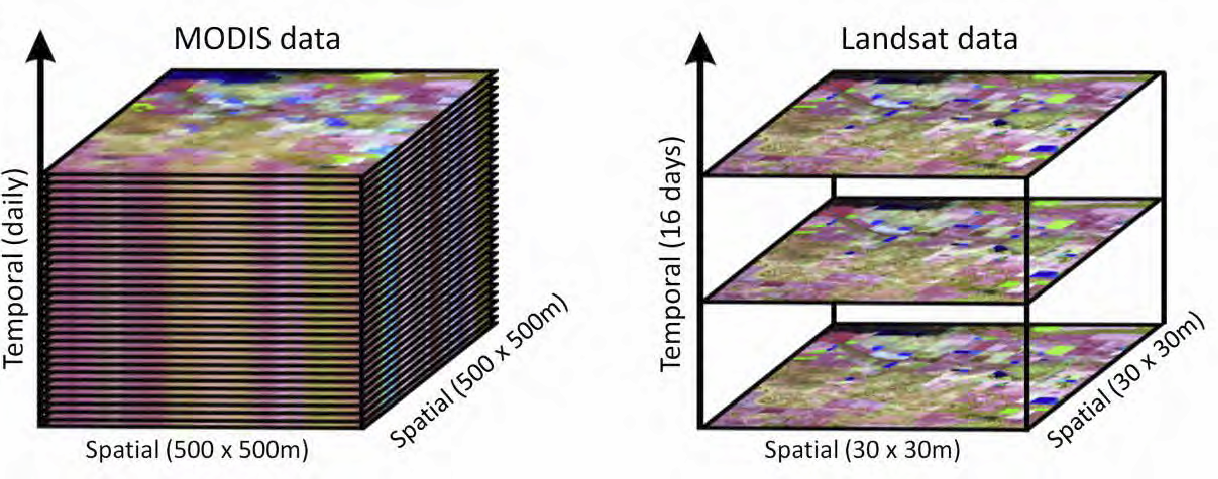
Landsat provides images every 16 days at high spatial resolution (25 m) – and four decades of imagery, extremely useful in global change research. But every 16 days means if there is cloud, there is no data and it might be 1-2 months before a cloud-free image is acquired. This makes it very challenging for hydrologists to close the water balance (based on the concept of conservation of mass).
They’ve also used data from the Moderate Resolution Imaging Spectroradiometer (MODIS). MODIS has a 2,330-km-wide viewing swath and, according to NASA “sees every point on our world every 1-2 days in 36 discrete spectral bands. Consequently, MODIS tracks a wider array of the earth’s vital signs than any other Terra sensor”. MODIS is low spatial resolution (250 m at best) yet daily so the chances of taking imagery cloud-free is higher.
McVicar and his team combined the high-frequency MODIS data with the high-resolution Landsat remote sensing data to overcome gaps due to cloud gaps, resulting in continuous 25m 8-day actual evapotranspiration monitoring from 2000 onwards.
Landsat-MODIS blending allows for high-resolution monitoring of actual evapotranspiration for use in water balance modelling, particularly useful in critical areas in the landscape such as irrigated paddocks and wetlands, says McVicar.
“Landsat-MODIS blending is one scientific approach to establishing actual evapotranspiration, one method that we’re using to help close the water balance. It’s offering ten times better spatial resolution (Landsat is 25m and MODIS is 250m) every eight days,” he says.
“Using information from two satellite remote sensing data sources the sum of the parts is greater than the individual components.”
ET insights into water use in forestry
The work has already provided insights for the forestry industry, charged water license rates per hectare in some jurisdictions. The forestry industry wanted to better understand water use and actual evapotranspiration rates of plantation forest and also to put this understanding in the context of non-plantation forests and other land uses.
The study assessed actual evapotranspiration rates from multiple land-uses in two regions, the Green Triangle crossing from South Australia to Victoria, and Tumut in New South Wales, and reported at the end of last year.
The results showed that both agricultural and native vegetation areas used more water than forestry plantations at both study sites. This is based on those land-uses covering a larger area. When assessing site actual evapotranspiration for ‘paired’ forestry softwood plantation sites and agricultural or native vegetation sites across the range of climates in each study site no significant differences in actual evapotranspiration rates were found.
It also found, however, that water use varied across plantations, which indicated that “forestry plantation water use needs to be considered on a site-by-site basis and within hydrological context”.
According to the report: “Having access to this information will allow the forestry industry to proactively work with Federal and State regulators to produce well-reasoned and quantitatively informed policy and management outcomes.”
Understanding water dynamics in Australia's north
Landsat-MODIS blending has also been used in the Northern Australia Water Resources Assessment as part of groundwater models, in a region where in the wet season, in summer, cloud cover can make optical satellite imagery very difficult to use.
The Assessment is investigating the potential for further development in three areas, in the Fitzroy River catchment in Western Australia, catchments near Darwin and in the Mitchell River catchment in Queensland.
In the Wildman catchment near Darwin there are small parcels of monsoon vine forest surrounded by Eucalyptus savannah, two habitats that consume water quite differently.
There are also two processes at play: 2 m of rainfall on average each year with recharge of some of that water to aquifers via sinkholes; and discharge of groundwater into rivers, creeks and billabongs via local springs.
If there is to be more irrigation in parts of Northern Australia there needs to be a better understanding of the hydrological connectivity of wetland and other groundwater dependent ecosystems.
CSIRO’s Principal Research Scientist Dr Russell Crosbie says Landsat-MODIS blending was used in establishing actual evapotranspiration rates in the Wildman as part of the Assessment.

“In rainforest areas in the Wildman catchment near Darwin we were trying to get a handle on the groundwater use. Rainforest transpires a lot more water than the savannah around them. Through remote sensing we can look at the groundwater discharge (the groundwater coming to the surface)," Crosbie says.
“The other side we were looking at was groundwater recharge. Subtracting the actual evapotranspiration in the savannah area from the rainfall gives the combined total of recharge and run off. Along with other methods such as looking at the water table fluctuations, remote sensing can give us a much better estimate of recharge.”
Some of the rainforest patches are 100 m across, too small for MODIS but Landsat data at 25m pixels provided the level of resolution required.
“Looking at ‘green-field’ sites such as the Wildman, we are investigating the water sources there to establish if there’s enough water to irrigate in areas with suitable soils. If we set up a system pumping groundwater are we going to have an impact on the sources which are important for ecosystems, for example.”
The results of the Assessment will be reported to the Commonwealth in June.
Better water monitoring
Landsat-MODIS blended measurements of actual evapotranspiration can be used to address issues of water allocation, water accounting and land-use-specific water management, and might be particularly useful in monitoring irrigation.
“In some parts of Australia, irrigation is poorly metered, and we need to understand the timing and volumes of irrigation water being applied if we’re going to close the water balance and best manage this precious resource that is so important to agricultural production, regional livelihoods and economies and ecological health,” says McVicar.
“Where irrigation is poorly metered, combining remote sensing-based measures of actual evapotranspiration with river system modelling and on-ground metering (where available) allows for enhanced irrigation system understanding.
“Remote sensing is useful because it can extend our understanding to a much larger scale, accurately and continuously at high resolution, allowing farmers and water managers to better keep track of all components of the water balance in our important agricultural areas.”
Dr Robert Argent, General Manager Water Bureau of Meteorology (BOM), says Landsat-MODIS blending provides a more direct measurement to fine tune BOM’s modelled actual evapotranspiration estimates and strengthens the contribution that remote sensing can make to fully understand the movement of water through our system.
“It’s another strong line of evidence in the management of water resources in Australia,” says Dr Argent.
“Evapotranspiration (ET) is well understood amongst technical people and the relevance of it to plant production is understood by many farmers who recognise ET as the surrogate for effective translation of soil moisture into crops.”
McVicar adds that Landsat-MODIS blending of actual evapotranspiration allows water use to be continuously assessed at 25m every 8-days from 2000 onwards. “This is extremely valuable to optimally manage water resources for multiple uses such as irrigated agriculture and environmental flows in a dry country like Australia.”
Read more on the forestry work via Remote sensing of land-use-specific actual evapotranspiration of entire catchments containing plantations.